Realtor.com®, a leader in online real
estate operated by Move, Inc., recently released its February data on
the U.S. housing market, offering valuable insight into the latest real
estate trends. Realtor.com®’s February 2013 national housing data
indicates that listing inventories increased 1.15 percent
month-over-month; median age of inventory was at 98 days, a 9.26 percent
decrease month-over-month; and median list prices were slightly higher
month-over-month at $189,900. These numbers show that home buyers are
getting an early start on the spring season despite the fact that
inventories recently hit record lows.
“As we enter the busiest time of the year for home buyers and
sellers, our latest housing trend data shows just how competitive the
market is with a significant national housing recovery well underway,”
said Steve Berkowitz, chief executive officer of Move, Inc. “Looking
ahead, we can expect the amount of inventory to increase this spring
along with higher list prices as sellers become more comfortable with
the market conditions.”
The median age of inventory was down by 9.26 percent month over month
and total listings are up 1.15 percent month over month, suggesting
that many reluctant home sellers are starting to take an early advantage
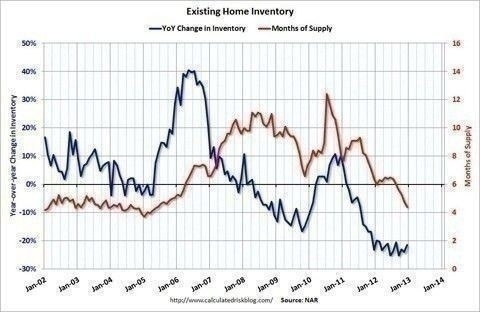
of the recent improvements in housing prices. Annual inventory
decreases of -15.97 percent are consistent with a gradual, yet
persistent downward trend that has been occurring over the last two
years. From January 2013 to February 2013, the median age of inventory
decreased in 145 of the 146 markets tracked by realtor.com®. The
national median list price also reversed its downward trend, rising by
1.55 percent over the month of February and 1.01 percent on an annual
basis. In addition, the number of markets experiencing a decline in home
prices is shrinking, implying more good news for the housing market and
U.S. economy at large.
There continue to be pronounced regional differences in the strength
of the housing market. Several areas in California are experiencing the
highest increases in list prices coupled with the largest inventory
declines. Phoenix, Seattle and Denver are also among the top performers
across the U.S. However, many smaller industrialized markets in the
Midwest and the Northeast registered year-over-year price declines, as
did Philadelphia, Chicago and New York City. While the number of markets
experiencing year-over-year list price declines had been increasing,
this pattern appears to be turning around as home list prices increased
in 78 markets last month on a year-over-year basis and declined in 39.
National Data
• In February, the total number of
single-family homes, condos, townhomes and co-ops for sale in the U.S.
(1,494,218) increased by 1.15 percent month-over-month. On an annual
basis, however, inventory was down by 15.97 percent.
• The national median list price for
single-family homes, condos, townhomes and co-ops ($189,900) increased
by 1.01 percent year-over-year and 1.55 percent month-over-month in
February.
• The median age of inventory of for sale
listings fell to 98 days in February, down 9.26 percent from January
and 11.71 percent below the median age one year ago (February 2012).
Regional Data
• Nearly all of the markets with the
largest year-over-year declines in their for sale inventories in
February were in California, where declines averaged 48 percent. The
list includes Sacramento, Stockton, Oakland, San Jose, Orange County,
Los Angeles, Seattle, San Francisco, Riverside and Ventura. These
markets also experienced a dramatic decline in the median age of
inventory, falling to an average of just 31 days, or 53 percent lower
than it was one year ago.
• On an annual basis, February median
list prices were up by 5 percent or more in 51 markets while they were
down by more than 5 percent in 11 markets. The number of markets
experiencing a year-over-year list price decline in February (39) is
significantly below the number of declines observed in January (50).
California markets continue to dominate the list of areas experiencing
the largest year-over-year increases in their median list prices,
representing nine out of the top ten best performers.
• The ten markets with the longest time
on the market continued to include the coastal areas of the Carolinas
and the resort communities of Santa Fe, NM and Ashville, NC. In
addition, five older industrialized areas also appear on the list:
Reading, PA; Portland, ME; Albany, NY; Philadelphia and Trenton, NJ.
California markets continued to dominate the list of top ten areas with
the shortest time on the market, although the median age of inventory
was also at record lows in Denver and Seattle. Median time on market in
these areas averaged just 28 days, 51 percent lower compared to one year
ago.
Realtor.com® regularly tracks real estate data and develops monthly
reports featuring the number of listings, median age of inventory and
median list price across the U.S. and in specific markets, as well as
provides year-over-year and month-over-month changes. These reports are
the only ones pulled directly from the realtor.com® database that
updates every 15 minutes from more than 800 multiple listing services.