Existing-home sales increased in August and reached the highest level in six-and-a-half years, while the median price shows nine consecutive months of double-digit year-over-year increases, according to the National Association of Realtors®.
Total existing home sales, which are completed transactions that include single-family homes, townhomes, condominiums and co-ops, rose 1.7 percent to a seasonally adjusted annual rate of 5.48 million in August from 5.39 million in July, and are 13.2 percent higher than the 4.84 million-unit level in August 2012. Sales are at the highest pace since February 2007, when they hit 5.79 million, and have remained above year-ago levels for the past 26 months.
Lawrence Yun, NAR chief economist, said the market may be experiencing a temporary peak. “Rising mortgage interest rates pushed more buyers to close deals, but monthly sales are likely to be uneven in the months ahead from several market frictions,” he said. “Tight inventory is limiting choices in many areas, higher mortgage interest rates mean affordability isn’t as favorable as it was, and restrictive mortgage lending standards are keeping some otherwise qualified buyers from completing a purchase.”
Total housing inventory at the end of August increased 0.4 percent to 2.25 million existing homes available for sale, which represents a 4.9-month supply at the current sales pace, down from a 5.0-month supply in July. Unsold inventory is 6.3 percent below a year ago, when there was a 6.0-month supply. “Limited inventory in some areas means multiple bidding remains a factor; 17 percent of all homes sold above the asking price in August, although 63 percent sold below list price.”
Data from NAR’s listing site, shows large declines in inventory from a year ago in Naples, Fla., down 23.5 percent; the Detroit area, down 23.3 percent; and the greater Boston area, down 20.7 percent.
According to Freddie Mac, the national average commitment rate for a 30-year, conventional, fixed-rate mortgage rose to 4.46 percent in August from 4.37 percent in July, and is the highest since July 2011 when it was 4.55 percent; the rate was 3.60 percent in August 2012.
The national median existing-home price for all housing types was $212,100 in August, up 14.7 percent from August 2012. This is the strongest year-over-year price gain since October 2005 when the median rose 16.6 percent, and marks 18 consecutive months of year-over-year price increases.
Distressed homes5 – foreclosures and short sales – accounted for 12 percent of August sales, down from 15 percent in July, and is the lowest share since monthly tracking began in October 2008; they were 23 percent in August 2012. Ongoing declines in the share of distressed sales are responsible for some of the growth in median price. Eight percent of August sales were foreclosures, and 4 percent were short sales. Foreclosures sold for an average discount of 16 percent below market value in August, while short sales were discounted 12 percent.
NAR President Gary Thomas, broker-owner of Evergreen Realty in Villa Park, Calif., said rising home values will encourage more people to sell. “As the equity position of most homeowners continues to improve, some who have been on the sidelines will list their home for sale,” he said. “Most of those owners also will be buying another home, but higher levels of new home construction going into 2014, combined with some reduction in demand from less favorable affordability conditions, will help to moderate price growth to more sustainable levels.”
The median time on market for all homes was 43 days in August, little changed from 42 days in July, but is much faster than the 70 days on market in August 2012. Short sales were on the market for a median of 98 days, while foreclosures typically sold in 52, days and non-distressed homes took 41 days. Forty-three percent of homes sold in August were on the market for less than a month.
First-time buyers accounted for 28 percent of purchases in August, down from 29 percent in July and 31 percent in August 2012.
All-cash sales comprised 32 percent of transactions in August, up from 31 percent in July and 27 percent in August 2012. Individual investors, who account for many cash sales, purchased 17 percent of homes in August, compared with 16 percent in July and 18 percent in August 2012. Last month, three out of four investors paid cash.
Single-family home sales rose 1.7 percent to a seasonally adjusted annual rate of 4.84 million in August from 4.76 million in July, and are 12.8 percent above the 4.29 million-unit pace in August 2012. The median existing single-family home price was $212,200 in August, which is 14.4 percent higher than a year ago.
Existing condominium and co-op sales rose 1.6 percent to an annual rate of 640,000 units in August from 630,000 in July, and are 16.4 percent above the 550,000-unit level a year ago. The median existing condo price was $211,700 in August, up 17.7 percent from August 2012.
Regionally, existing-home sales in the Northeast were unchanged at an annual rate of 710,000 in August but are 12.7 percent above August 2012. The median price in the Northeast was $268,800, up 7.6 percent from a year ago.
Existing-home sales in the Midwest increased 3.1 percent in August to a pace of 1.32 million, and are 18.9 percent higher than a year ago. The median price in the Midwest was $166,100, which is 10.0 percent above August 2012.
In the South, existing-home sales rose 3.8 percent to an annual level of 2.19 million in August and are 13.5 percent above August 2012. The median price in the South was $181,000, up 14.6 percent from a year ago.
Existing-home sales in the West declined 2.3 percent to a pace of 1.26 million in August but are 7.7 percent higher than a year ago. With the tightest regional inventory conditions, the median price in the West rose to $287,500, which is 18.8 percent above August 2012.
Source: NAR

Are We in a Recovery or an Expansion Market?
Economic markets are cyclical, and real estate is no exception.
Typically, we see a period of expansion, followed by a contraction, followed
then by stabilization and recovery, and again into expansion. For those of you that have been
through more than one real estate boom and contraction, you may be asking, “Where are we in the cycle?”
Here's a breakdown of how those cycles work.
Stabilization
Policymakers work on reducing the impact of an unstable economy, and
try to move to the path of recovery. Some techniques used by policymakers
include creating new job opportunities, controlling inflation, and stabilizing the currency exchange rate.
Financing should remain flowing for business start ups and growth plans as a
way of injecting money back into the economy. Inflation must be controlled
because high inflation discourages investors to purchase products or
securities, since they are more expensive than before.The overall goal should
be to create consumer confidence, encourage investment, and stimulate business
growth.
Recovery
This is an increase in business activity after the lowest point of the
depression has been reached. Entrepreneurs begin to feel that the economic
situation was after all not so bad. This leads to improvement in business
activity and greater confidence in the economy. This in turn leads to stronger
industrial production, which picks up slowly and gradually. The volume of
employment also steadily increases. The analysts and economists are able to
track by watching for a slow rise in prices accompanied by a small rise in
profits. Wages also rise. New investments take place in capital goods
industries, which in turn increases GDP and return on investment. The banks
also expand credit. Pessimism is gradually replaced by an atmosphere of all
round cautious hope. There seems to be
greater demand than supply.
Expansion
This stage is characterized by increased production, high capital
investment in basic industries, and expansion of bank credit, high prices, high
profits and full employment. There is a general feeling of optimism among
businessmen and industrialists. Production increases to supply demand,
sometimes leading to the emergence of boom. In this stage of rapid expansion we
see high stocks and commodity prices, high profits, over supply and overfill
employment. There is undue optimism among businessmen and industrialists who
make additional investments in the various branches of the economy. The number
of jobs exceeds the number of workers available in the market. Such a situation
is known as overfill employment. Profits touch a new height. Businessmen
further increase their investments. Runaway inflation raises its head in all
its ugliness. Prices risk sky-high. The tempo of boom reaches new heights.
There is an atmosphere of over-optimism all around. This oversupply carries
with it seeds of self-destruction. Bottlenecks begin to appear in various
sectors of the economy.
Contraction phase
Over-optimism is replaced now by over-pessimism characterized by fear
and hesitation on the part of equity and business leaders. The failure of some
businesses creates panic among businessmen. The banks begin to withdraw loans
from business enterprises. With the downturn of demand and lending, more
business enterprises fail. Prices collapse and confidence is shaken. Building
construction slow down and unemployment appears in basic, capital goods
industries which gradually spread to other industries as well. As more
unemployment happens it leads to fall in income, expenditure, prices and
profits. Recession has a cumulative effect. Once a recession starts, it goes on
gathering momentum and finally assumes the shape of depression. It is a
protracted period in which business activity in the country is far below the
normal. It is characterized by a sharp reduction of production, mass unemployment,
low employment, falling prices, falling profit, low wages, contraction of
credit, a high rate of business failures and an atmosphere of all round
pessimism and despair. All construction activities come to a more or less
complete standstill during a depression. So after that charming and uplifting
lesson, where is the nation, Texas and our local metros in the cycle?
US – Stabilization
The Federal Reserve lowers rates, then gradually allows increase, as
housing and job growth historically follow. When the rates are at zero, the
Federal Reserve uses other stimulus, such as quantitative easing (QE) to
encourage growth. This has been mildly effective. As the Fed reduces stimulus,
rates will rise.
Texas – Recovery / Expansion
Supply and demand is in balance, and home/land value appreciation meets
or beats inflation.
Austin – Expansion
Economic housing formation as well as other real estate channel demand
exceeds supply. Housing and real estate appreciation stronger. Austin is about
2+ years from the bottom of the market; we have seen healthy demand and now are
seeing banks, developers, and builders trying to fill the void left by no
activity the last 6+ years. Austin has a ways to go in this cycle hopefully.
The one governing factor in Austin is the length of entitlement, which is about
2 ½ years for development. This has been helpful in preventing quick
development and sometimes over development to meet the immediate need.
Houston – Expansion
Economic housing formation as well as other real estate channel demand
exceeds supply. Housing and real estate appreciation stronger.
San Antonio – Recovery
Demand has picked up, putting pressure on supply.
Dallas/Fort Worth – Recovery
Demand has picked up, putting pressure on supply.
Why is Texas so different from the rest of the United States? Two
words: job creation. Since 2009, 43% of all jobs created in the US were created
in Texas. Over the last six months, nearly every facet of the U.S. economy has
shown improvement, and the real estate market is no exception.
Source:Mark Sprague, State Director of Information Capital
Plan Now for a Year-End Investment Review
You might not enjoy sitting down to do year-end investment planning, but at least this fall you can make plans with greater certainty. For the last three years, investment planning has meant trying to anticipate possible changes in tax law; for tax year 2013 and beyond, you know for sure how income, capital gains, and qualifying dividends will be taxed. That gives you an opportunity to fine-tune your long-term planning, or to develop a plan if you've postponed doing so. Here are some factors to keep in mind as the year winds down.
Consider harvesting your losses
With tax rates settled, the question of whether to sell losing positions to generate capital losses that can potentially be used to offset capital gains or $3,000 of your ordinary income becomes a much more straightforward decision. That process is known as harvesting tax losses, and it could prove especially worth considering this year. The first half of the year produced strong gains for U.S. equities; even a mediocre second half could still have the potential to leave you with a higher tax bill than you had anticipated.
To maximize your losses for tax purposes, you would sell shares that have lost the most, which would enable you to offset more gains. Unless you specify which shares of stock are to be sold, your broker will typically treat them as sold based on the FIFO (first in, first out) method, meaning that the first shares bought are considered to be the first shares sold. However, you can designate specific shares as the ones sold or direct your broker to use a different method, such as LIFO (last in, first out) or highest in, first out.
Interest rates: bane or blessing?
The Federal Reserve has said that if the economy continues to recover at its expected pace, it could raise its target Fed funds rate sometime in 2014. However, investors have been anticipating such an increase since early summer, when many bond mutual funds began seeing strong outflows from investors concerned that a rate increase could hurt the value of their holdings. As any consumer knows, lower demand for a product often means lower prices. And since bond prices move in the opposite direction from bond yields, yields on a variety of fixed-income investments have begun to rise. However, there also could be a silver lining for some investors. Higher yields could provide welcome relief for individuals who rely on their investments for income and have suffered from rock-bottom yields.
The Fed has said any rate decisions will depend on future economic data. However, now might be a good time to assess the value of any fixed-income investments you hold, and make sure you understand how your portfolio might respond to a future that could include higher interest rates. Many investors' asset allocation strategies were likely developed when conditions generally favored bonds, as they have for much of the last 20 years. Though asset allocation alone can't guarantee a profit or prevent the possibility of loss, make sure your asset allocation is still appropriate for your circumstances as well as the current investing climate. And don't forget that other financial assets can be affected by potential future interest rate changes as well.
Calculating cost basis for fixed-income investments
The IRS had originally planned to require brokers to begin reporting the cost basis for any sales of bonds and options this year, as it already does for stocks and mutual funds. It has now postponed implementation of the requirements for bonds until January 1, 2014 to give financial institutions more time to test their reporting systems. However, don't throw away your old records yet, especially if you're considering selling any of your bond holdings. The cost basis reporting requirements will apply only to bond purchases and options granted or acquired on or after January 1, 2014, so you'll still be responsible for calculating your cost basis for any bonds or options acquired before that date.
Source: Sean Henderson, Waddell & Reed cell: 210-784-6952
shenderson@wradvisors.com
shenderson@wradvisors.com
This information is not meant as financial or investment advice pertaining to your personal situation. The selection of appropriate investment, insurance or planning options and/or strategies should be made on an individual basis after consultation with appropriate legal, tax and financial advisors.
Top 10 Wood Rot Problems You Want to Repair
Wood rot happens when 2 conditions exist – moisture levels reach/exceed
20 percent and where there is a food source (wood) for wood destroying
fungi to grow. The average moisture content of building lumber ranges
from 12 to 15% and heating systems will reduce it further. Houses
properly designed, built and maintained to keep moisture levels low,
shouldn’t have wood rot problems but we know it happens.
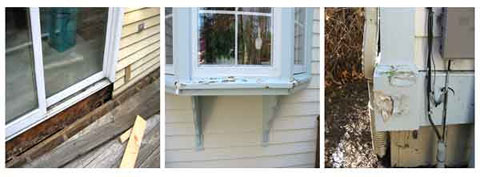
Wood rot problems occur more frequently outdoors where water puddles on wood features like window sills. Wood rot also occurs when water is absorbed by wood like the plywood sheathing behind your siding, and can’t dry out because there isn’t enough ventilation.
The most common form of wood rot is wet rot where decay happens in areas where lumber has become and remains wet. Dry rot is caused by specific fungi and it’s more serious because it is spread by spores, seemingly without moisture although we know that’s still required. Both types of wood rot if not addressed, will cause structural damage to your house.
How to Avoid Wood Rot
Houses are built from wood and that isn’t going to change quickly, although metal framing and new technologies like Insulating Concrete Forms (ICFs) for foundations and framing are entering the market. Homeowners need to focus on minimizing moisture buildup around and inside their homes.
Simple things like trimming foundation plantings for air flow around your foundation and thinning out trees will help keep your home dry. Installing gutters and making sure the land slopes away from your home will help prevent water leaking into your house. Indoors you’ll want to inspect around water features (sinks, dishwasher, washing machine, toilets and tubs/showers) for leaks that could cause wood rot.
When repairing wood rot, consider using composite materials like Azek instead of wood. Remember that wood rot only happens where there’s a food source (wood) and moisture.
Most Common Wood Rot Problems
Here are the top 12 wood rot problems homeowners have to deal with, starting at your roof line. By inspecting these areas of your home annually and making repairs quickly, you’ll minimize your maintenance costs and protect your home.
- Wood right below the roof line
- Behind gutters and downspouts
- Wood trim that sticks out from the house
- Wood above and around doors and windows
- Window sills are especially prone to wood rot
- At the bottom of exterior doors
- Kick plates or vertical boards right below exterior doors
- Garage door and surrounding wood trim/siding
- Deck ledger board where it attaches to the house
- Deck floor boards when water can’t drain through to ground
- Deck posts where they meet the ground
- Top of foundation if foundation plantings don’t let wood dry out

Changes in USDA Maps for Property Eligibility

New mapping shows everything within the 410 loop is not eligible as well as everything inside the 1604 loop from Hwy 90. Outside the 1604 loop the cities that are now mostly excluded are Schertz, Cibolo, Converse, Garden Ridge, Northcliff, New Braunfels and Seguin. These new guidelines will go into effect October 1.
For more details and to see the map go to http://eligibility.sc.egov.usda.gov/eligibility/welcomeAction.do and click on "future eligibility areas."
In addition, as always there are very specific guidelines for income requirements as well. Those guidelines can be reviewed on that site as well.
OPEN HOUSE: Saturday 9/14 3:00 to 5:00 PM

3811 Valencia Point -- New Home! Ready to move in... This home has it
all -- extended master suite, hardwood floors in the dining room, family room
and hallways to bedrooms and master suite. The second level features a game
room with a bedroom and full bath.
2,941Square Feet 4 Bedrooms 3 Bathrooms
Directions: From Loop 1604
and Hwy 281
Go east on Loop 1604 3 miles and exit at Bulverde Road
Turn left on Bulverde
Road (heading north) and go 0.8 mile.
The entrance to Valencia Hills (Highland Homes) is on the
right.
Home values: The 5 best and worst markets for the Second Quarter of the year
Home values rose by 12.2 percent nationally in the second quarter of
2013 compared to the same period in 2012, according to data from the
National Association of Realtors.
The five worst markets, where prices fell the fastest.
The five worst markets, where prices fell the fastest.
Texas named the "Best Business Climate" state

Texas also placed in the top 10 for data centers, aerospace/defense, biotechnology employment, nuclear power generation, credit quality and renewable energy capacity. Business Facilities previously named Texas the 2013 State of the Year in January.
“Employers across the country know the Texas model works. Our low taxes, smart regulations, skilled workforce and fair courts have created an economy that offers businesses the best chance at success,” Gov. Rick Perry says. “These principles have helped us create one-third of the net new jobs in the nation over the past 10 years, providing more opportunity for hardworking families. Texas is a national example for job creation; that’s why I’ll be in Missouri this week, and have traveled to other states like California, Illinois and New York to share our state’s economic success story.”
The magazine wrote that Texas has become a global leader in semiconductors and other high-tech growth sectors, such as, bioscience. This is all buoyed by a world-class university system.
To Read the full report click here.
Buyer and Seller Guide to Multiple Offer Negotiations
If a home is in a desirable area and in good condition, there is the potential that there will be mulitiple offers for that property. Here's a breakdown of how that situation is handled from both the buyer's side and then the seller's side.
Information for Buyers
Sellers can accept the “best” offer; they can inform all potential purchasers that other offers are “on the table”; they can “counter” one offer while putting the other offers to the side awaiting a decision on the counter-offer; or they can “counter” one offer and reject the others.
While the listing broker can offer suggestions and advice, decisions about how offers will be presented – and dealt with – are made by the seller - not by the listing broker.
There are advantages and disadvantages to the various negotiating strategies you can employ in multiple offer negotiations. A low initial offer may result in buying the property you desire for less than the listed price – or it may result in another buyer’s higher offer being accepted. On the other hand, a full price offer may result in paying more than the seller might have required. In some cases there can be several full price offers competing for the seller’s attention – and acceptance.
Your buyer-representative will explain the pros and cons of these (and possibly other) negotiating strategies. The decisions, however, are yours to make.
In some cases sellers may make other buyers aware that your offer is in hand, or even disclose details about your offer to another buyer in hope of convincing that buyer to make a “better” offer. In some cases sellers will instruct their listing broker to disclose an offer to other buyers on their behalf.
Listing brokers are required to follow lawful, ethical instructions from their clients in the same way that buyer representatives must follow lawful, ethical instructions from their buyer-clients. While some REALTORS® may be reluctant to disclose terms of offers, even at the direction of their seller-clients, the Code of Ethics does not prohibit such disclosure. In some cases state law or real estate regulations may limit the ability of brokers to disclose the existence or terms of offers to third parties.
Realize that as a represented buyer, your broker likely has other buyer-clients, some of whom may be interested in the same properties as you are. Ask your broker how offers and counter-offers will be presented and negotiated if more than one of her buyer-clients are trying to buy the same property.
Appreciate that your buyer-representative’s advice is based on past experience and is no guarantee as to how any particular seller will act (or react) in a specific situation.
Information for Sellers
Your listing broker can explain various negotiating strategies for you to consider. For example, you can accept the “best” offer; you can inform all potential purchasers that other offers are “on the table” and invite them to make their “best” offer; you can “counter” one offer while putting the other offers to the side awaiting a decision on your counter-offer; or you can “counter” one offer and reject the others.
If you have questions about the possibility of multiple offers and the way they can be dealt with, ask your listing broker to explain your options and alternatives.
Realize that each of these approaches has advantages and disadvantages. Patience may result in an even better offer being received; inviting buyers to make their “best” offers may produce an offer (or offers) better than those “on the table” – or may discourage buyers who feel they’ve already made a fair offer resulting in them breaking off negotiations to pursue other properties. Your listing broker will explain the pros and cons of these strategies (and possibly other) negotiating strategies. The decisions, however, are yours to make.
Appreciate that your listing broker’s advice is based on past experience and is no guarantee about how any particular buyer will act (or react) in a specific situation.
Information for Buyers and Sellers
Perhaps no situation facing buyers or sellers is more potentially frustrating or fraught with potential for misunderstanding and for missed opportunity than presenting and negotiating multiple, competing offers to purchase the same property. Consider the following issues and dynamics:
- Sellers want to get the highest price and best terms for their property.
- Buyers want to buy at the lowest price and on the most favorable terms.
- Listing brokers – acting on behalf of sellers – represent sellers’ interests.
- Buyer representatives represent the interests of their buyer-clients.
- Will a seller disclosing information about one buyer’s offer make a second buyer more likely to make a full price offer? Or will that second buyer pursue a different property?
- Will telling several buyers that each is being given a chance to make their “best offer” result in spirited competition for the seller’s property? Or will it result in the buyers looking elsewhere?
- What’s fair? What’s honest? Why isn’t there a single, simple way to deal with multiple competing offers?
- Knowledgeable buyers and sellers realize there are rarely simple answers to complex situations. But some fundamental principles can make negotiating multiple offers a little simpler.
- Realize the listing broker represents the seller – and the seller’s interests, and the buyer-representative represents the buyer – and the buyer’s interests. Real estate professionals are subject to state real estate regulation and, if they are REALTORS®, to the Code of Ethics of the National Association of REALTORS®.
Subscribe to:
Posts (Atom)